
The problems are known. What has been missing is the scoreboard.
Potholes, dry taps, dead streetlights, uncollected waste. Nagrik turns each complaint into a published number for the ward it happened in — so a citizen, a commissioner and a state secretary are all looking at the same record.
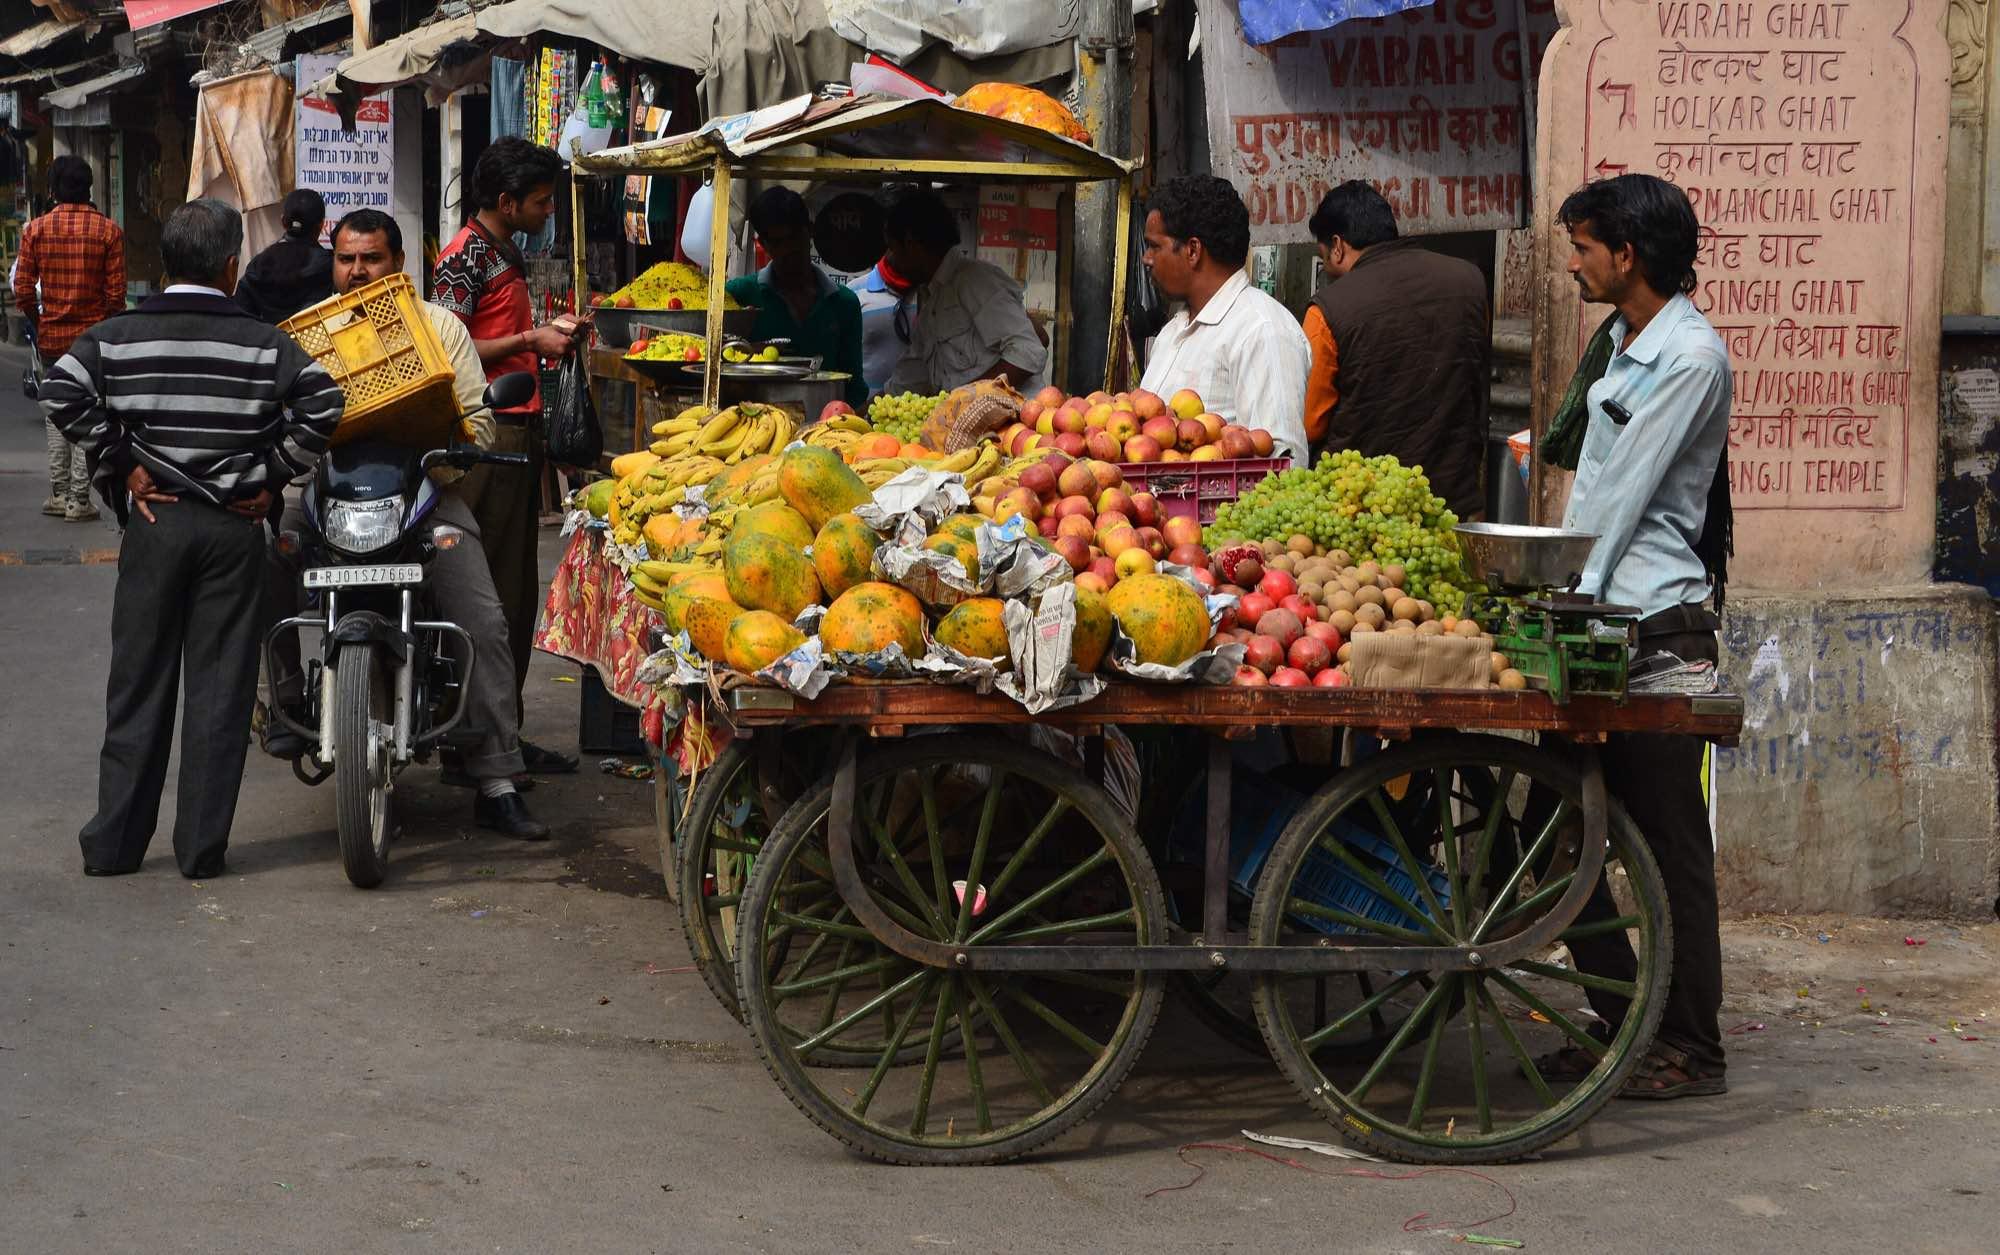
Clément Bardot / CC BY-SA 4.0 · Wikimedia Commons
Needs attention now
Hadapsar is the lowest-scoring ward in the index
54 out of 100, with 218 reports still open. The ward page shows which of the six services is pulling it down and how long each has been unresolved.
54Pune · out of 100
The national index at a glance
LiveConforms to GIGW 3.0 and WCAG 2.1 Level AA
Every ward in India, measured on one honest number.
Nagrik turns citizen complaints into a published, auditable Civic Health Score for every ward — so municipal performance is visible to the citizen, the commissioner and the state, on the same page.
- States covered
- 3
- Cities covered
- 4
- Wards covered
- 12
- Reports · 24 hours
- 1,283
Who Nagrik is for
For citizens
One form, six categories, under a minute. Every report gets a public reference number and a page anyone can watch — no account required.
File a reportFor urban local bodies
Ward, zone and department dashboards with median resolution time, SLA breach rate and 12-week trend — refreshed hourly, not quarterly.
Open the dashboardFor researchers and auditors
Geo-tagged, time-stamped, structured records. Published methodology, open weights, NDSAP attribution on every derived dataset.
Read the methodologyWard performance
Where the index is highest, and where it is not
Both panels use the same 0–100 scale, so a score means the same thing in each. Score bands carry an icon and a word, never colour alone.
Highest scoring wards
Top six wards across every covered city.
6 wards, highest score first.
| Ward | City | Civic Health |
|---|---|---|
| Aundh | Pune · Maharashtra | 78 |
| Banjara Hills | Hyderabad · Telangana | 76 |
| Bandra West | Mumbai · Maharashtra | 74 |
| Gachibowli | Hyderabad · Telangana | 73 |
| Kothrud | Pune · Maharashtra | 72 |
| Indiranagar | Bengaluru · Karnataka | 70 |
| Ward | City | Civic Health |
|---|---|---|
| Aundh | Pune · Maharashtra | 78 |
| Banjara Hills | Hyderabad · Telangana | 76 |
| Bandra West | Mumbai · Maharashtra | 74 |
| Gachibowli | Hyderabad · Telangana | 73 |
| Kothrud | Pune · Maharashtra | 72 |
| Indiranagar | Bengaluru · Karnataka | 70 |
Wards needing urgent attention
Lowest six wards across every covered city.
6 wards, lowest score first.
| Ward | City | Civic Health |
|---|---|---|
| Hadapsar | Pune · Maharashtra | 54 |
| Whitefield | Bengaluru · Karnataka | 58 |
| Andheri West | Mumbai · Maharashtra | 61 |
| Kukatpally | Hyderabad · Telangana | 62 |
| Erandwane | Pune · Maharashtra | 67 |
| Koramangala | Bengaluru · Karnataka | 69 |
| Ward | City | Civic Health |
|---|---|---|
| Hadapsar | Pune · Maharashtra | 54 |
| Whitefield | Bengaluru · Karnataka | 58 |
| Andheri West | Mumbai · Maharashtra | 61 |
| Kukatpally | Hyderabad · Telangana | 62 |
| Erandwane | Pune · Maharashtra | 67 |
| Koramangala | Bengaluru · Karnataka | 69 |
City comparison
City rankings
Every covered city, ranked on its mean ward score with the 30-day change alongside.
A city score is the unweighted mean of its ward scores. Weighting by population is documented in the methodology and reported separately.
Early warnings and live reports
Early warnings
What the model expects next
Forecasts with a stated confidence and the evidence behind them. A prediction without its evidence is an opinion.
- Pune · Hadapsar81% confidence
Monsoon waterlogging expected at Magarpatta junction within 72 hours
- Drainage complaints up 42% against the previous week
- IMD heavy-rain alert in force for Pune district
- 2024 backflow pattern repeating at the same three inlets
Horizon · 72 h
- Hyderabad · Kukatpally86% confidence
Transformer failure likely at the KPHB block 5 substation
- Three outages logged in the last 30 days
- Audible humming reported twice by residents
- Transformer age 14 years, past the 12-year service band
- Ambient temperature forecast 41 °C for four consecutive days
Horizon · 96 h
- Bengaluru · Whitefield74% confidence
Water tanker demand surge expected — advance booking advised
- Scheduled Cauvery supply cut for 48 hours
- Demand pattern matches the same week last year
- 12 borewells currently offline in the ward
Horizon · 48 h
Public record
Live citizen reports
The most recent published reports across every covered ward.
Live
Transformer humming, sparks
ResolvedMissing manhole cover
TriagedStreet lights out
SubmittedNo supply for 3 days
In progressGarbage uncollected for 4 days
TriagedEvery report shown here is public and carries a reference number. Names appear only where the citizen chose to give one.
How it works
What happens after you report
Four steps, each with the commitment attached to it. No points, no badges — the guarantee is the closure record.
- 01
File the report
Six categories, one screen, no account. A photograph and a landmark are enough.
Under a minute
- 02
Get a public reference number
Issued immediately. Anyone with the number can view the report and its status history.
Immediate
- 03
Triage routes it to the department
Category and ward determine the responsible department and the service window that applies.
Within 24 hours
- 04
Closure is published, not claimed
A closed report stays visible with its resolution time, and can be disputed if the work was not done.
Permanent record
Report an issue
Reporting is anonymous unless you choose to give a name. Your phone number is never published.
Public programmes
National programme alignment
Which published reporting obligations this platform already satisfies, and in whose units.
Swachh Bharat Mission — Urban
Ministry of Housing and Urban Affairs
Sanitation and solid-waste complaints are captured with ward geometry and closure times, the same units used in Swachh Survekshan citizen-feedback scoring.
AMRUT 2.0
Ministry of Housing and Urban Affairs
Water-supply and sewerage service levels per ward, with median restoration time — directly comparable to the mission's service-level benchmarks.
Smart Cities Mission
Ministry of Housing and Urban Affairs
Ward dashboards and a documented open-data method, suitable as a citizen-facing layer over an existing integrated command and control centre.
CPGRAMS
Department of Administrative Reforms and Public Grievances
Every report carries a public reference number and an auditable status history, so escalation to the central grievance system needs no reconciliation.
NDSAP
Open Government Data Platform India
Derived datasets are published with attribution, a stated licence and a machine-readable schema, in line with the National Data Sharing and Accessibility Policy.
GIGW 3.0
National Informatics Centre
Accessibility, multilingual access, policy disclosure and content-review dates are implemented as platform features rather than a compliance annexe.
These are statements of technical alignment with published programme requirements. They are not claims of endorsement, empanelment or affiliation with any ministry, department or mission.
Coverage
Cities covered today
12 wards across 4 cities in 3 states. Coverage expands ward by ward, never by estimate.
Content last reviewed 2026-07-24. GIGW 3.0 · WCAG 2.1 Level AA.